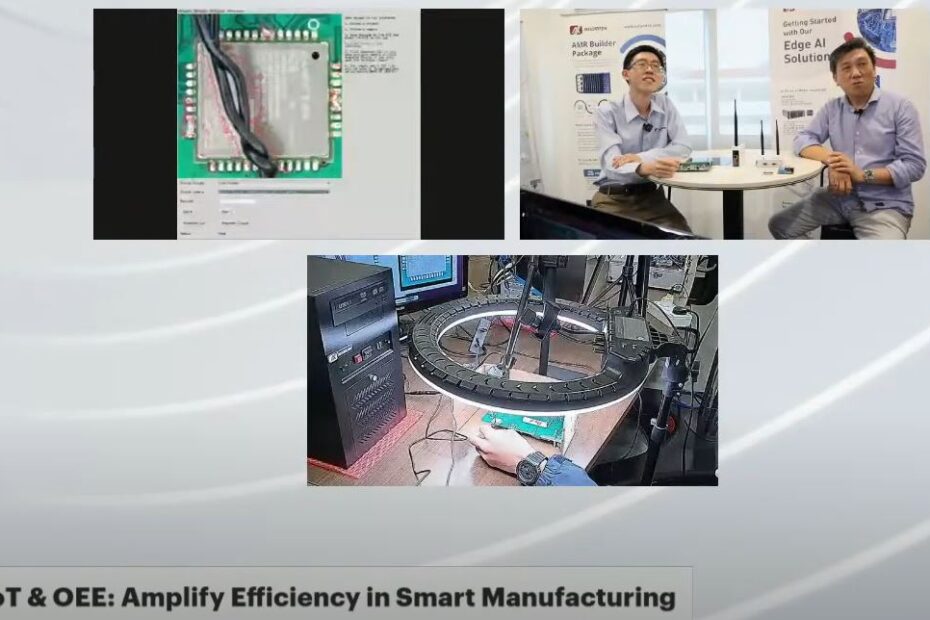

In this ” Let’s Sembang AIoT” live session, We shared the very practical and peace of mind technique that make up an OEE ( Overall Equipment Effectiveness) Tracking system which is widely used in most of the manufacturing process. It is a cost-efficient yet easy-to-implement solution in making up the OEE Tracker.
Overall Equipment Efficiency (OEE) is a commonly used metric in the manufacturing industry that assesses the effectiveness of a manufacturing process. OEE is a measure of how effectively a manufacturing operation is utilized, considering both the machine availability and the quality of the products it produces.
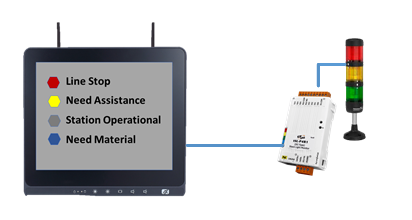
We shared the two main parts that allow you to build up an OEE system, namely the stack light module and the Axiomtek IIoT edge gateway . These two components are the machine data collectors that acquired all necessary data to be used in the calculation of OEE.
To calculate Overall Equipment Effectiveness (OEE), you need specific machine data related to three key factors: Availability, Performance, and Quality. OEE is a metric commonly used in manufacturing to measure the efficiency and productivity of equipment or machinery. Each factor is calculated as a percentage, and the OEE is the product of these three percentages. Here’s what you need for each factor:
Availability:
Planned Production Time: The total time the machine should be available for production during a specific period (usually excluding breaks, maintenance, and scheduled downtime).
Operating Time: The actual time the machine was running and available for production.
Availability = (Operating Time / Planned Production Time) x 100%
Performance:
Ideal Cycle Time: The time it takes for the machine to produce one unit under optimal conditions.
Actual Cycle Time: The average time it takes for the machine to produce one unit based on the real production data.
Total Count: The total number of units produced during the given period.
Performance = (Total Count x Ideal Cycle Time) / Operating Time x 100%
Quality:
Good Count: The number of units produced that meet the quality standards or are considered good units.
Total Count: The total number of units produced during the given period.
Quality = (Good Count / Total Count) x 100%
Finally, calculate the OEE by multiplying the Availability, Performance, and Quality percentages:
OEE = Availability x Performance x Quality
OEE Tracking with IIoT Edge HMI gateway
OEE Tracking with IIoT Edge Gateway
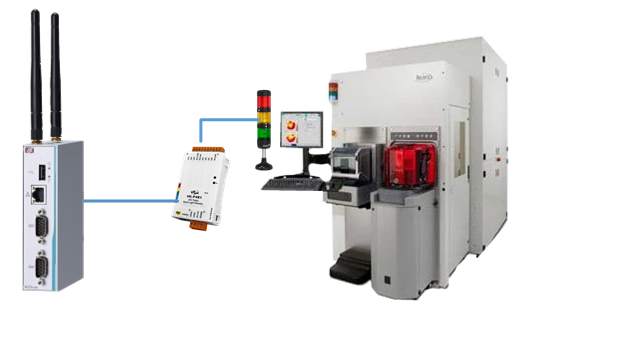
The Stack light module is able to gather almost all the information need for OEE but you need to decide which are the signals that you need to tap on in order to realized the value of those value needed, example of Availability, it will be able to gather it from the the Tower light signal status where this is the source of the status of the machine including the up and down of the machine. Secondly, the Performance, the counting of the part producted can be next where it indicate the number of the parts produced and the cycle time ( performance) can be extracted timing of the counter value captured from one to the next. CCLee mentioned that if you have two bins with good and defects, the quantity data capture will automatically become your good and NG count ( This is where the Q factor is identified). The above made up a simple OEE value. This Value in percentage will allow you to tell you how efficient is your process.
The Overall Equipment Effectiveness (OEE) value provides a comprehensive measure of equipment or machine efficiency in manufacturing processes. By analyzing the OEE value, you can quickly assess the overall performance and identify areas that require improvement. Here’s how to interpret the OEE value:
OEE is represented as a percentage, ranging from 0% to 100%. A higher percentage indicates better efficiency and performance, while a lower percentage indicates inefficiency and potential problems.
Breakdown of OEE Components:
Availability: Represents how often the machine is available for production. A low availability percentage suggests that the machine experiences a significant amount of downtime due to breakdowns, maintenance, or other reasons.
Performance: Reflects how well the machine performs compared to its optimal capacity. A low-performance percentage implies that the machine is not operating at its maximum speed or is suffering from slowdowns.
Quality: Measures the proportion of good units produced compared to the total output. A low-quality percentage indicates a high number of defective or rejected products.
Identifying Improvement Areas:
A high OEE indicates that the machine is operating efficiently, producing high-quality products, and experiencing minimal downtime.
A low OEE highlights potential issues that need attention. It could be caused by equipment breakdowns, inefficient operation, or poor product quality.
Benchmarking:
OEE values can be compared with industry benchmarks or previous performance to gauge how well the equipment is doing compared to similar machines or past periods.
OEE Trend Analysis:
Tracking OEE over time helps identify patterns and trends in machine performance. If the OEE is declining, it indicates a need for investigation and corrective actions to improve efficiency.
Root Cause Analysis:
When the OEE value is low, it’s essential to conduct a root cause analysis to pinpoint the factors contributing to the inefficiency. This analysis may involve examining machine logs, maintenance records, operator performance, and other relevant data.
Continuous Improvement:
OEE is a valuable metric for implementing continuous improvement initiatives. By monitoring OEE and addressing issues that affect availability, performance, or quality, manufacturers can make informed decisions to enhance overall efficiency and productivity.
In summary, OEE is a powerful metric that provides a holistic view of equipment efficiency. By analyzing the OEE value and its components, manufacturers can optimize processes, increase productivity, and enhance the overall performance of their operations.
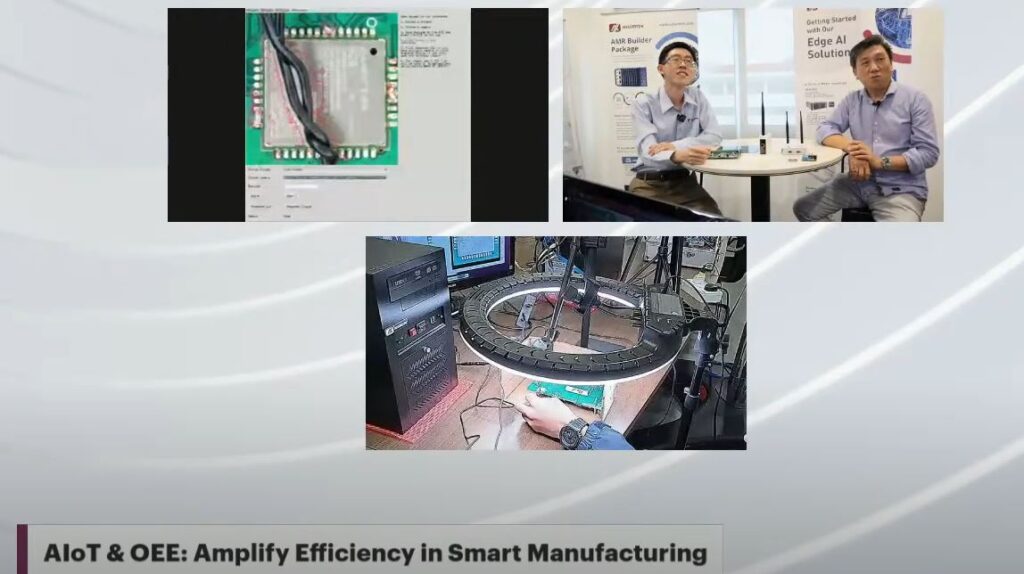
During this live session, we will explore how unsupervised deep learning AI techniques are applied to enhance the visual inspection process of printed circuit boards (PCBs). Traditionally, visual inspection requires good eyesight and careful checking of each point on the PCB, which can be time-consuming and reliant on human labor.
To address these challenges, we have integrated an AI system powered by unsupervised deep learning algorithms into an Axiomtek industrial PC. This AI system acts as an inferencing station for sorting defects or soldering issues on the PCB. By leveraging AI, we have significantly increased the effectiveness of the inspection process while reducing the reliance on human labor.
The AI system uses unsupervised learning, which means it can learn patterns and features from the data without explicit labeling or human intervention. This allows the AI to adapt and generalize to different types of defects that may be present on the PCB.
By integrating the AI system with the Overall Equipment Effectiveness (OEE) system, we can streamline the process further. The AI system’s output, which categorizes and identifies defects, is fed into the CPU to calculate the accurate Quality factor for the PCB. This integration provides fast and precise results throughout the inspection process.
The advantages of this AI-powered visual inspection system are manifold:
Enhanced Efficiency: The AI system can process data at high speed and perform inspection tasks rapidly, significantly reducing inspection time compared to manual methods.
Improved Accuracy: AI algorithms are capable of analyzing vast amounts of data with high precision, leading to more accurate defect detection and classification.
Reduced Dependence on Human Labor: By automating the inspection process, we lessen the reliance on human operators and eliminate the fatigue-related errors that can occur during manual inspection.
Scalability: The AI system can handle large volumes of PCBs without compromising the inspection quality, ensuring scalability to meet increasing production demands.
Real-time Monitoring: The integrated OEE system allows for real-time monitoring of the inspection process and quality metrics, enabling prompt corrective actions if needed.
In conclusion, the integration of unsupervised deep learning AI techniques into the visual inspection process for PCBs using an Axiomtek industrial PC has revolutionized the quality control process. The accurate and fast defect identification, along with seamless integration with the OEE system, empowers manufacturers to improve their production efficiency and deliver higher-quality products to customers.
you may watch the recorded live session on the Youtube at the link below:-
Pingback: Artificial intelligence In Smart Manufacturing - Axiomtek industrial PC Malaysia
Pingback: Fog computing complements Edge and Cloud - Axiomtek industrial PC Malaysia
Pingback: AIOT OEE Insight Connect with Adisra SCADA - Axiomtek industrial PC Malaysia
Comments are closed.